The dialog yield analysis (market segments) compares different reference figures (number of rooms or guests, accommodation or food revenue, etc) in different clients over a period of time.
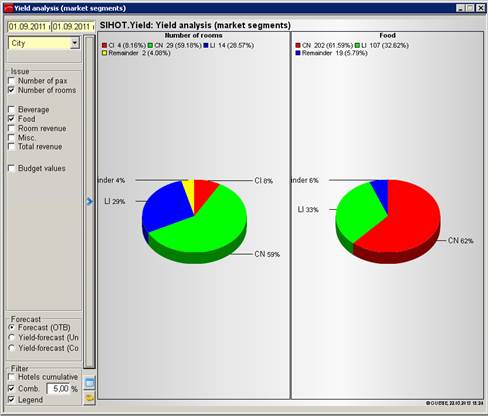
Figure 18: Comparing market segments in terms of number of rooms and food revenue
The analyses shows a pie chart, where the “pieces” correspond to the market segments. You can compare a maximum of four clients or four reference figures to ensure that the display is not overloaded.
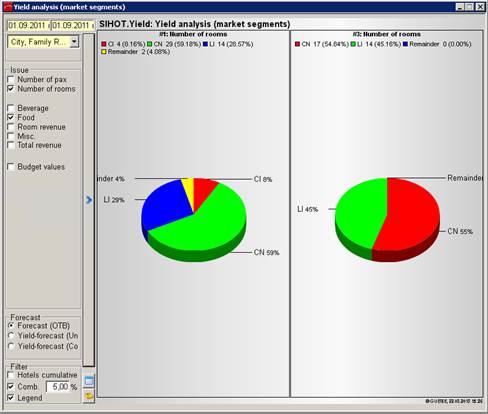
Figure 19: Comparing market segments in client 1 and client 2
When using the filter hotels cumulative, you can select more than four clients with a maximum of four different reference figures at once.
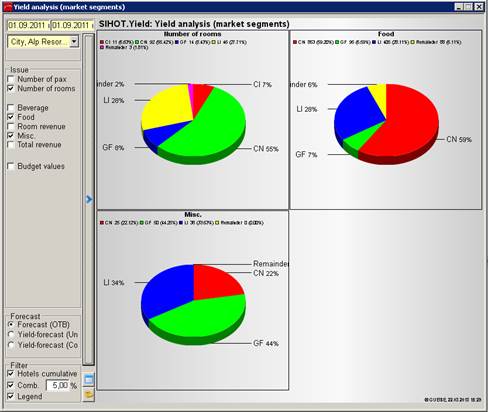
Figure 20: Comparing market segments with cumulated figures for both clients in terms of number of rooms, food and misc. revenue
You can also call up a comparison of actual vs. budgeted figures by ticking the checkbox budget values. The analyses is shown in form of a bar chart. If you have selected more than one client, the figures will be cumulated automatically.
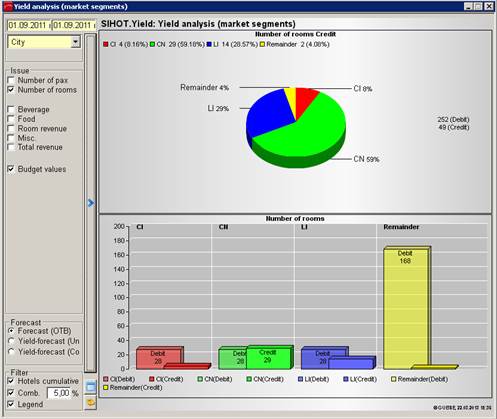
Figure 21: Market segment analysis with budget