The column accounts/day contains the following figures:
•Previous day
Shows the balance of all guest accounts of the previous day, excluding reservation accounts.
•Deposit
Shows the balance of the reservation accounts. If a service was posted as a deposit entry, the amount remains 0. The actual deposit figure is listed in the transferred deposits report.
•Revenue
Shows the posted revenues according to the posted services. The revenue is reduced by the posted expenses.
•Payments
These are payments as per the cash journal/posted payments analogue to the payment type-sums.
•Today
Balance of all guest accounts. The balance equals the balance on the guest account list.
•Control Sum - Accounts
The control sum is calculated as follows:
balance previous day
+ revenue
- sum of payments
- +: When working with the city ledger management, the credit card and debtor-invoices are also calculated in the debtors’ control sum, as these increase the balance of the debtors.
The column debtors/day contains the following figures:
•Previous day
Shows the city ledger balance of the previous day
•Revenue
Shows any credit card payments posted
•Payments
These are payments as per the cash journal/posted payments analogue to the payment type-sums.
•Today
City ledger balance; this balance balance equals the balance on the report city ledger balances.
•Control Sum - Debtors
The control sum is calculated as follows:
balance previous day
- sum of payments posted on city ledgers
+ city ledger entries by credit card on guest accounts
+ city ledger entries by invoice on guest accounts
+ city ledger entries by credit card writing off city ledgers
The column outstanding/day shows the sum of the two left columns (accounts/day and debtors/day). The balance shows the up-to-date accounts receivable.
The report features a fourth section, if the function Commission Handling is serialised. This shows a control sum made up from all payments and services that were posted to commission and creditor accounts.
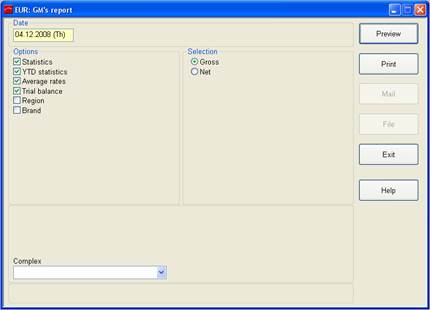
Figure 77: GM's report
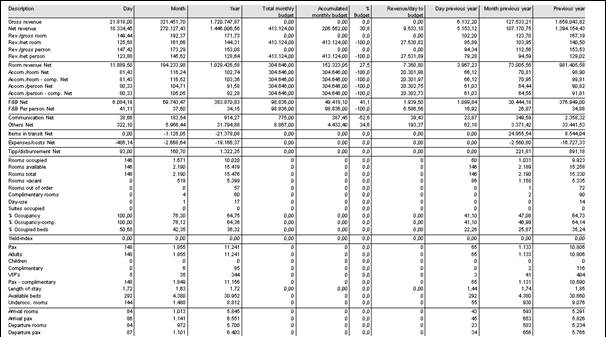
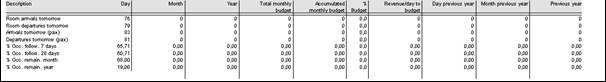
Figure 78: Sample statistics section
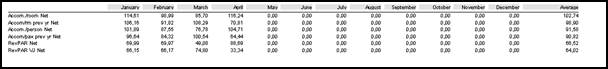
Figure 79: Sample average rates section
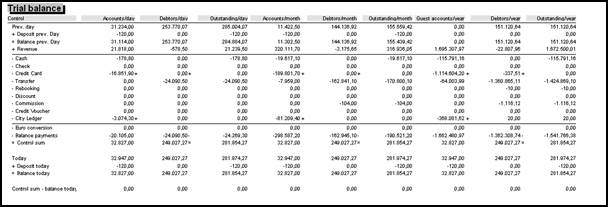
Figure 80: Sample trial balance