This graphic analysis shows the actual performance of the Sales staff in relation to the targets set in their guidelines. It is called up in the menu Master Files – Sales & marketing.
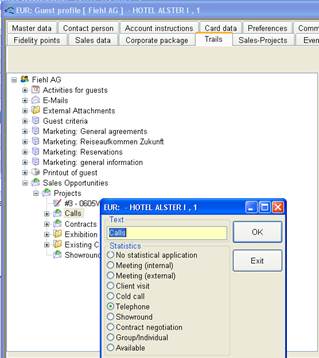
Prerequisite for this analysis is to define entries in the trails in relation to the tasks (budget type). Highlight the entry and select rename entry from the context menu. Then assign the task for all activities under this branch to be recognised as the same.
Figure 51: Rename Entry
This graphic analysis
The display can be varied using the following parameters:
•date (default: current hotel date)
•selected type of budget
•sales person
•comparison with yearly values
•comparison to previous year
•comparison to current budget
•3-D view
•rotation (turning axis)
•reducing the graphic’s size by overlapping display
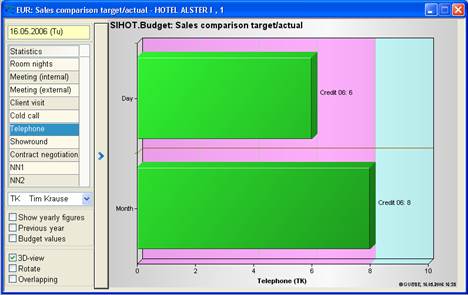
Figure 52: Comparison of Guideline and Actual Performance of a Sales Staff