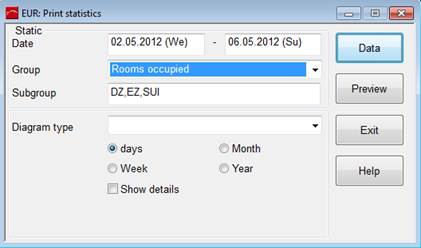
The print statistics programme in the Sales & Marketing menu graphically displays different statistics. Select a report period, the groups and sub-groups.
Enter a time period for the requested analysis and select the group. Press the button data. The program edits the data in the background and asks you for the form of the display. Chose one of the types of display and mark whether the analysis is to be made by day, week, month or year.
Figure 29: Printing Statistics
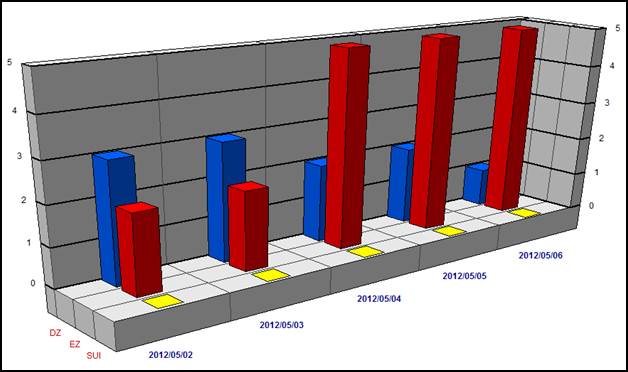
Figure 30: Graphic display of projected occupancy