 .
The top graph now shows current occupancy levels, together with a reference line
which is the occupancy level 21 days ago. The lower graph illustrates how the
booking situation has changed during the past 21 days in form of a bar
chart.
.
The top graph now shows current occupancy levels, together with a reference line
which is the occupancy level 21 days ago. The lower graph illustrates how the
booking situation has changed during the past 21 days in form of a bar
chart.This tab shows the current booking situation compared to any date in the past.
For example, if you want to see how the bookings increased
or decreased compared to three weeks ago, enter 21 in the field Number of days in the
past and click Search .
The top graph now shows current occupancy levels, together with a reference line
which is the occupancy level 21 days ago. The lower graph illustrates how the
booking situation has changed during the past 21 days in form of a bar
chart.
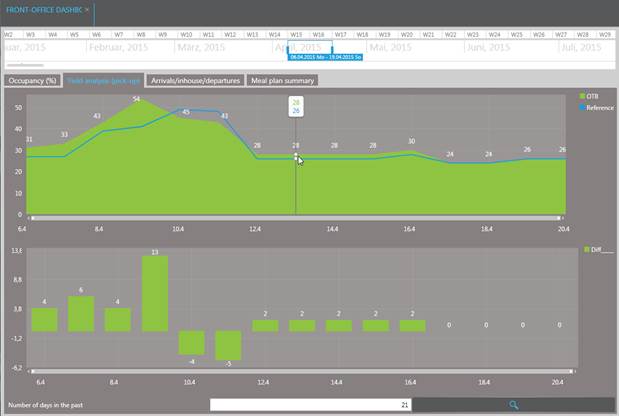
Figure 12: Yield analysis – pick-up over the past 21 days