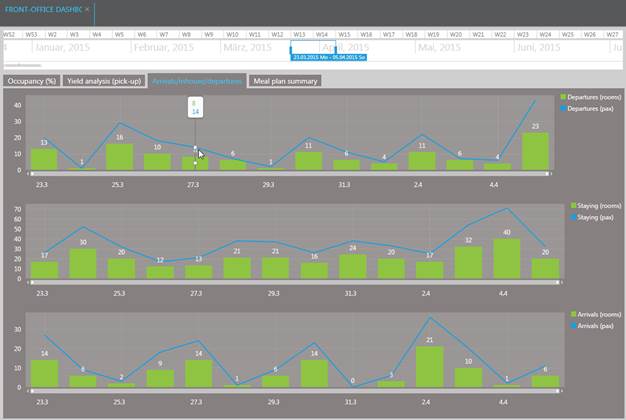
This analysis can also be of interest to the Housekeeping department and F&B: it shows the current movement figures per day, which may be helpful in planning the staffing levels for each day. The figures in the graphs include the number of rooms as well as the number of guests.
The top graph shows departures, the middle one stay-overs and the bottom graph arrivals.

Figure 13: Rooms and guest movement data