 .
.To create the charts, proceed as follows:
Ø Use the date bar to define the period you wish to analyse.
Ø In MPE-installations, you can select specific
properties for the analysis. Enable the toggle key Filter and click
Show hotel selection  .
.

Figure 34: Calling up a property-selection window in MPE-installations
Ø In the field Number of days in the past, enter days to back to the date you want to compare the current booking situation with, e.g. 7 to compare the figures from a week ago.
Ø If you don’t select a specific market segment, SIHOT analyses the reservations of all market segments.
Ø If you select one or more market segments, SIHOT provides separate figures for all market segments and for the selected market segments.

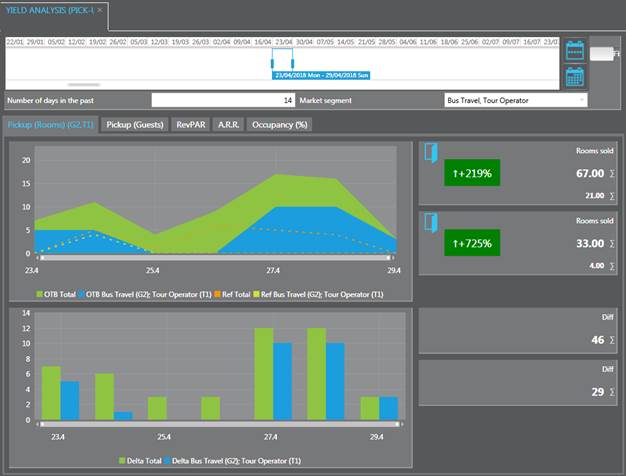
Figure 36: Pick-up analysis with market segments
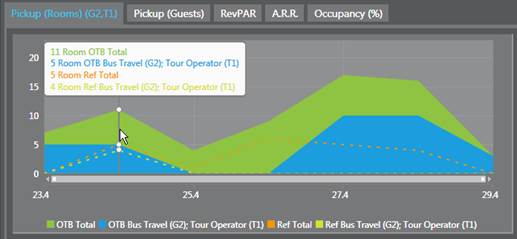
The top line-graph shows the following four figures, which are shown individually for each day in a tooltip:
1. Rooms OTB total:
= the number of all booked rooms now (green area)
2. Rooms OTB market segment:
= the number of rooms booked in the selected market segment now (blue area)
3. Rooms reference total:
= the number of rooms booked in total on the comparison date (dotted orange line)
4. Rooms reference market segment:
= the number of rooms in the selected market segment booked on the comparison date (dotted yellow line)

Figure 38: Line graph
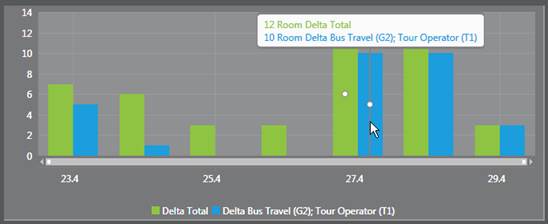
The bar chart below shows the difference in room numbers booked on each day of the selected period. If there were any cancellations, these bars may also go into minus-figures.

Figure 40: Bar chart
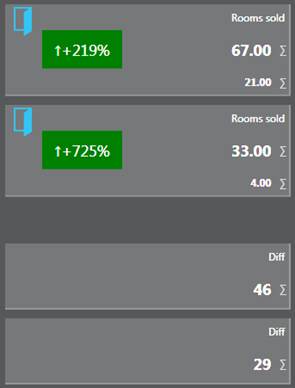
The analysis also presents the following figures
•Rooms sold (total)
The upper figure is the total number of rooms sold in the selected period.
The smaller figure below that is the number of rooms that were already sold on the comparison date.
In the rectangle, you can see the increase or decrease in percent.
•Rooms sold (market segment)
Here you can find the same figures as above, only in relation to the selected market segment.
•Diff (total)
Number of rooms sold within the period after cancellations.
•Diff (market segment)
The same figure as above only in relation to the selected market segment.
Figure 41: Summary

Figure 42: Summary
Open the respective tabs to obtain the same analyses for:
•Pickup guests
•ARR
•Occupancy %